ERP & Data Analytics| SaaS Engineering| Founder, ProStackNG
I build data pipelines into decisions and ideas into production-grade software. From Power BI dashboards tracking ₦14M petroleum operations to multi-tenant SaaS platforms serving Nigerian businesses.

Core Tools
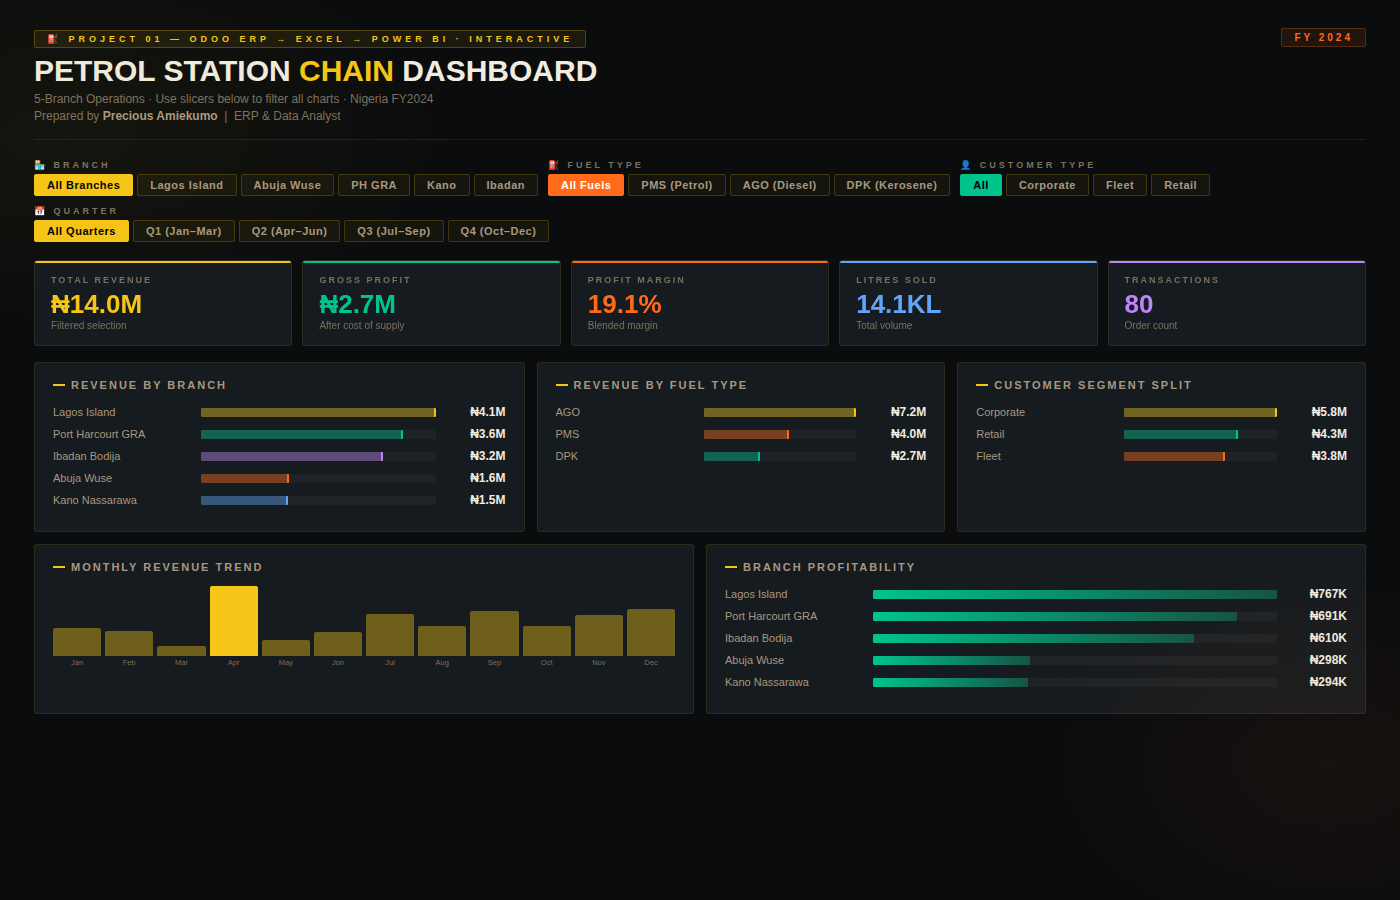
5-branch ops, ₦14M revenue, fuel breakdown (PMS/AGO/DPK), branch profitability. Odoo ERP → Excel → Power BI.
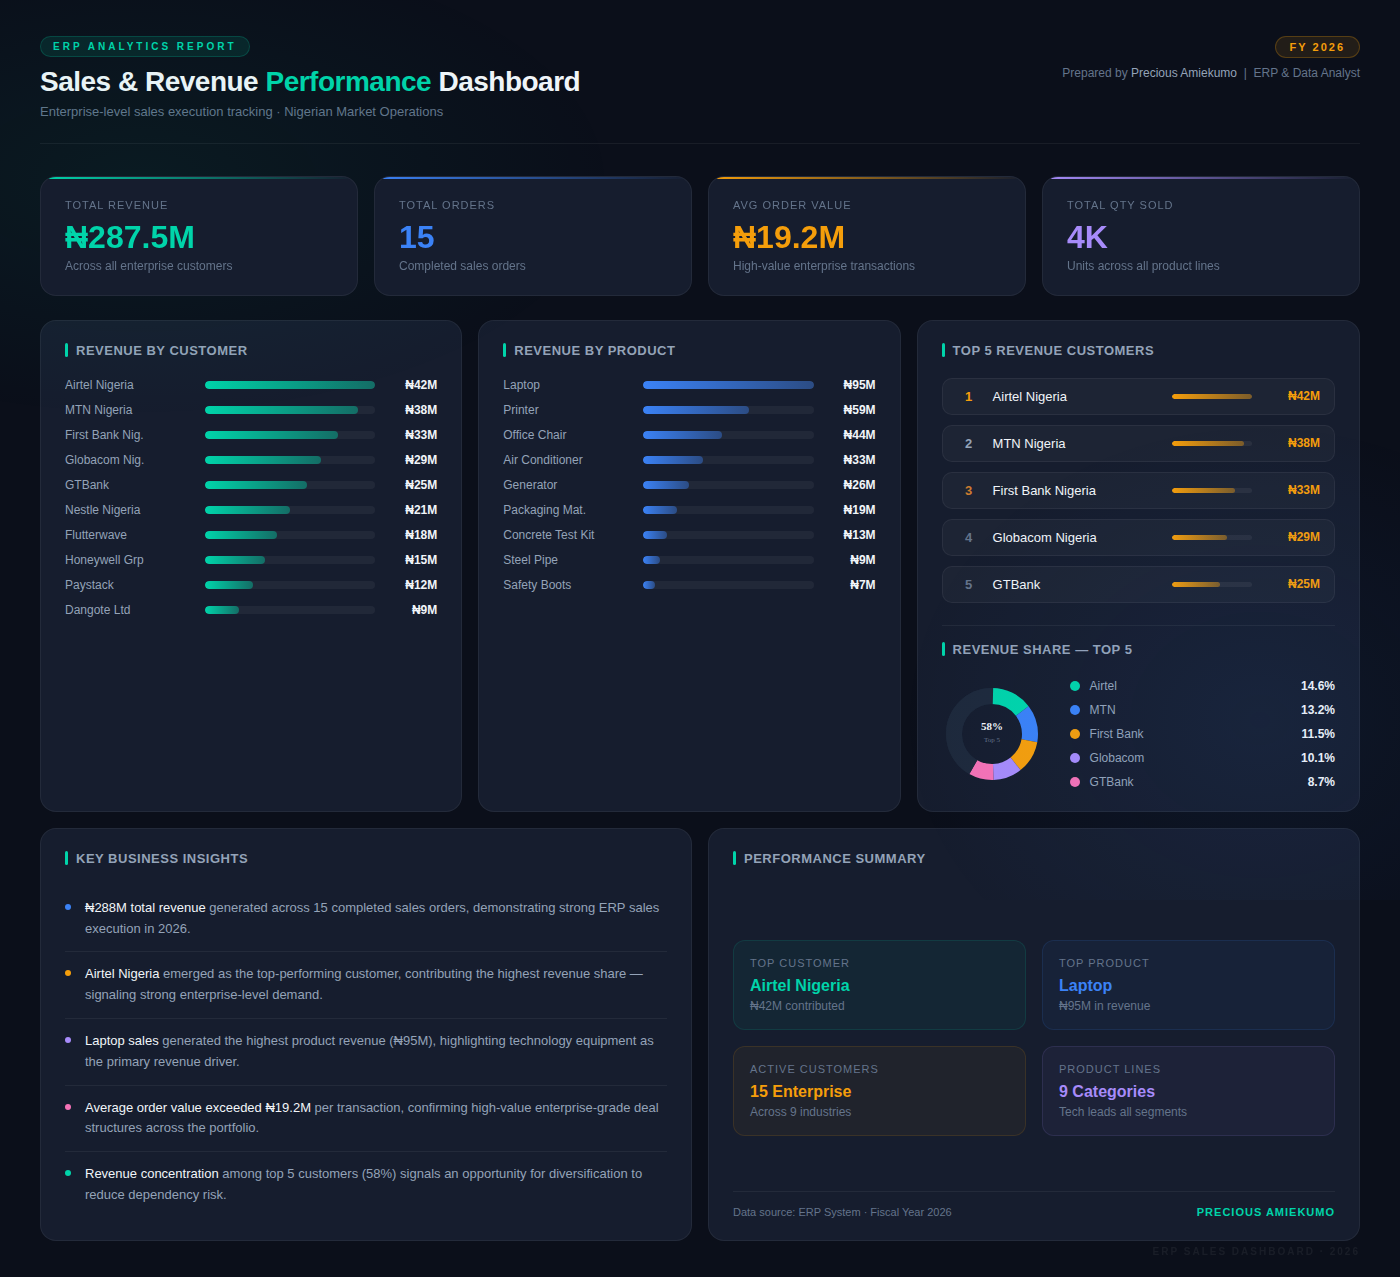
₦287.5M revenue, 15 orders, top-5 customer concentration (58%), Nigerian enterprise market.
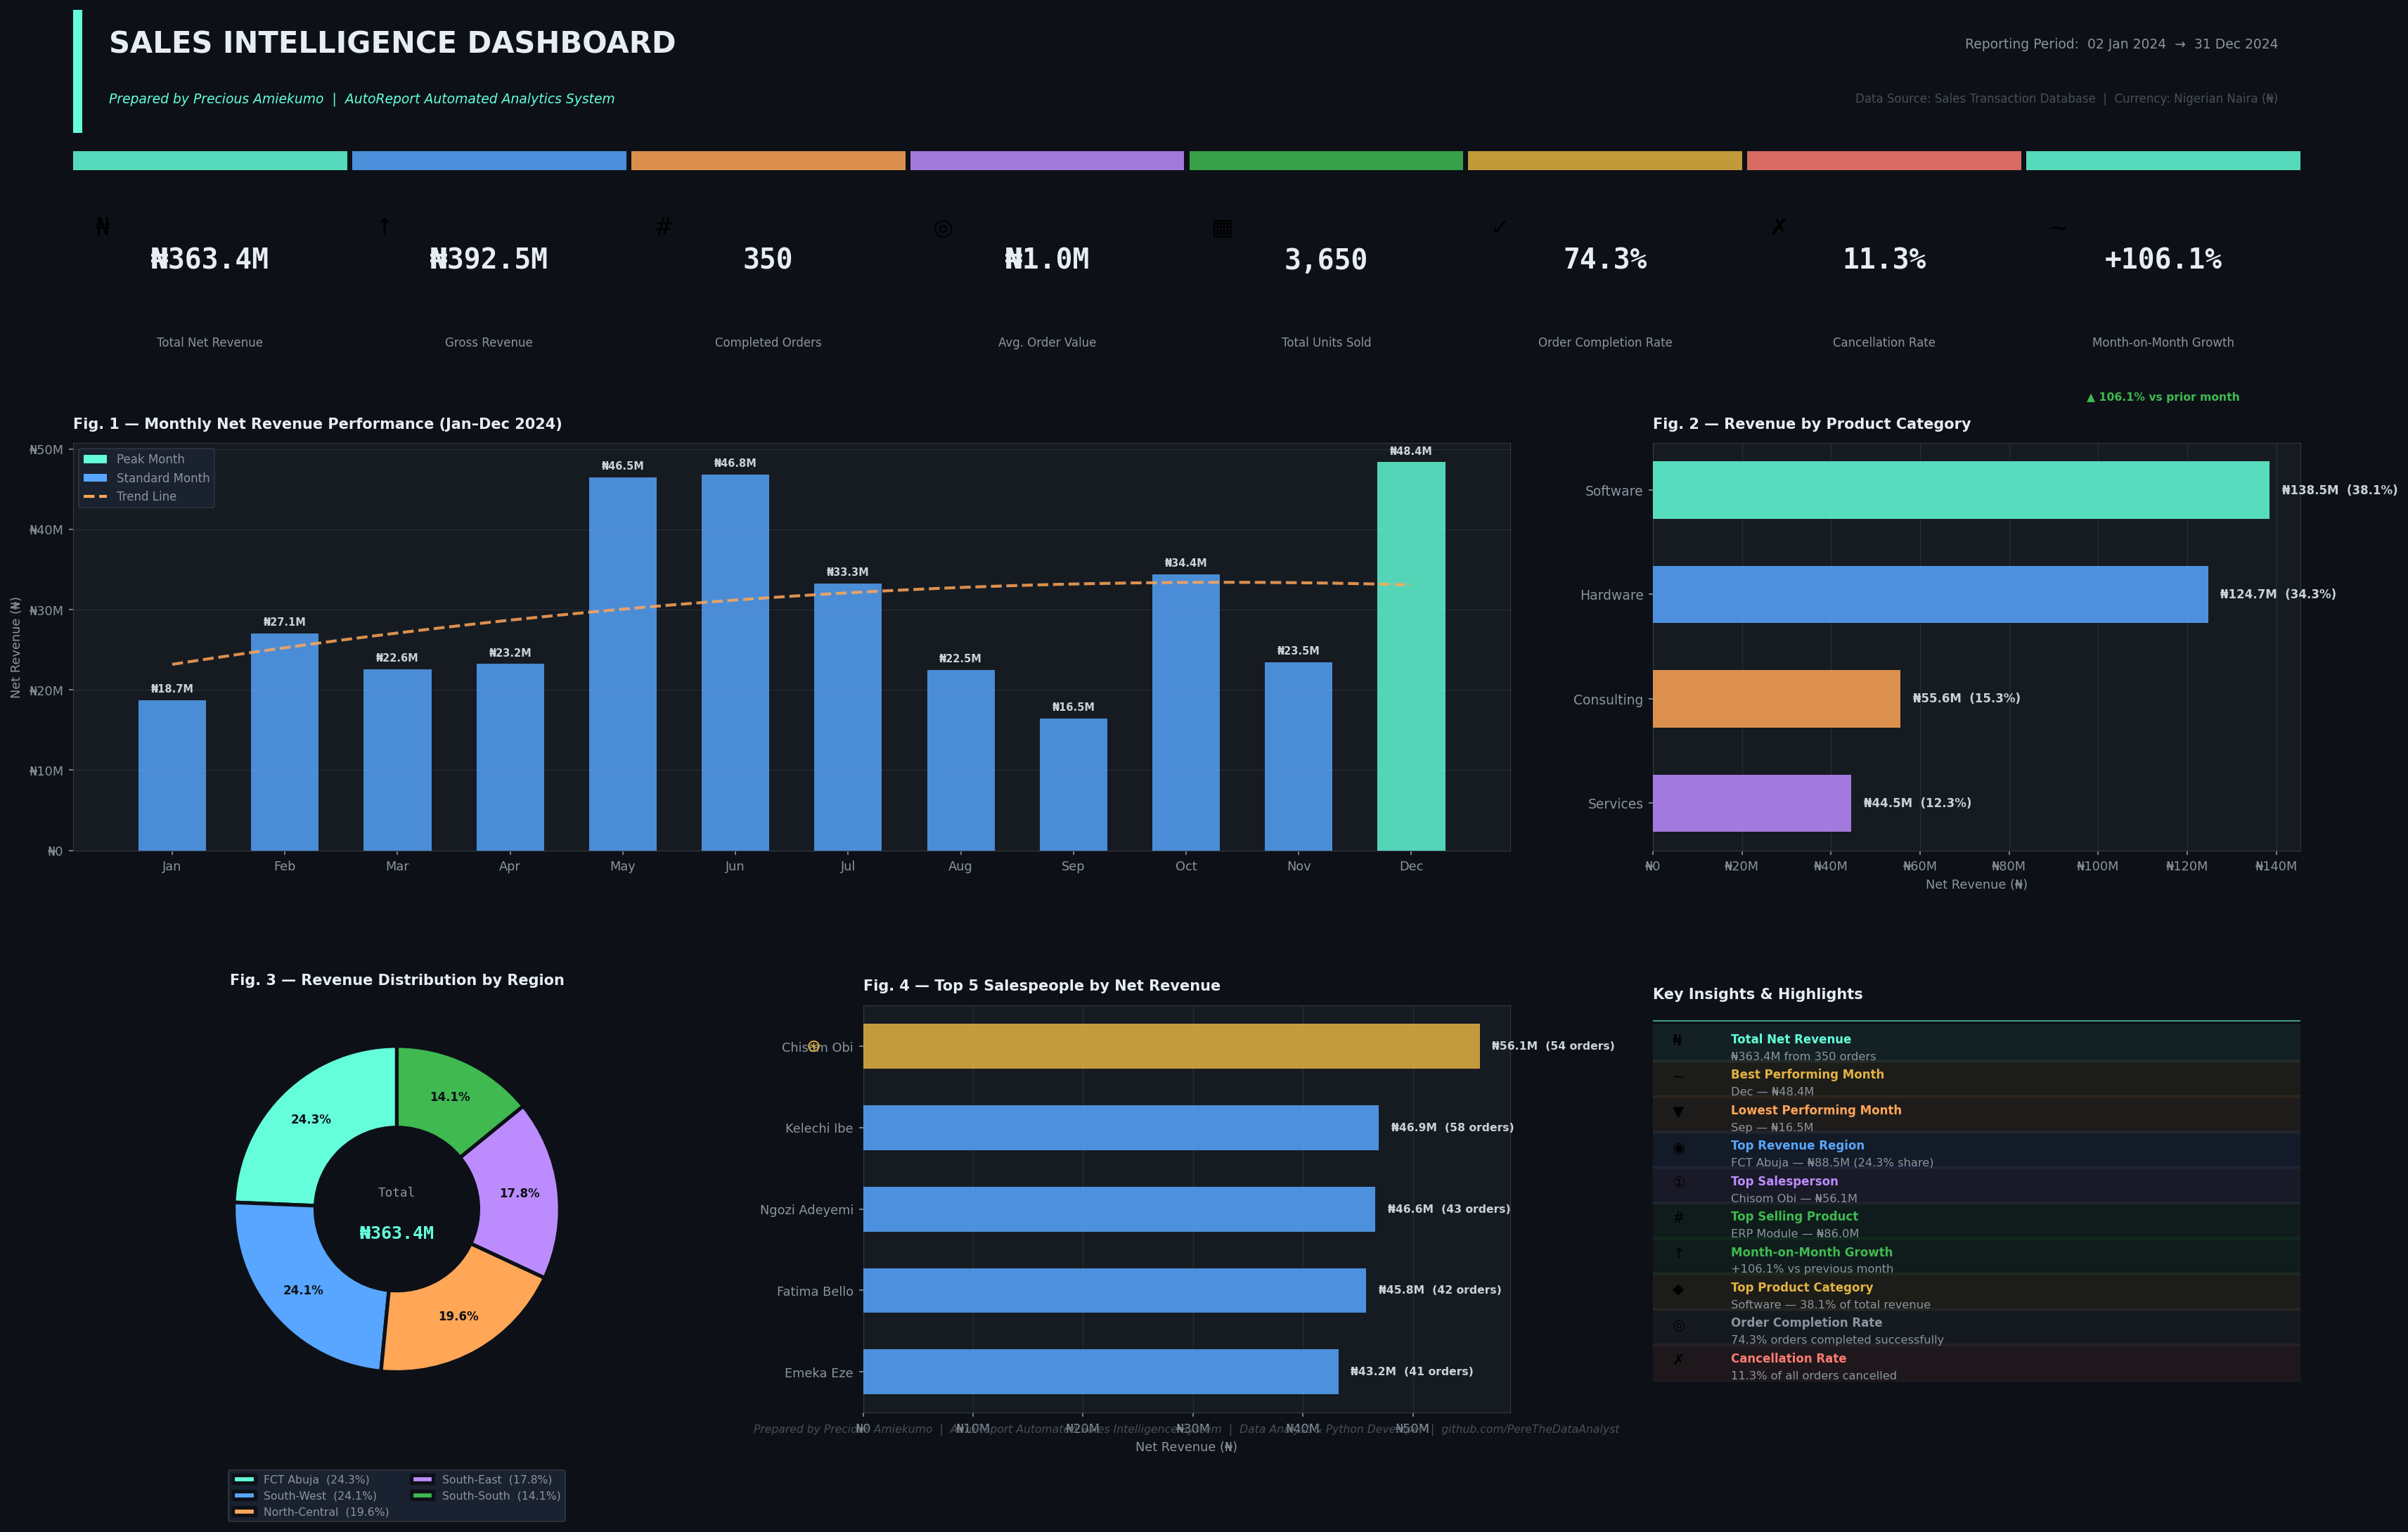
₦363.4M net revenue, +106.1% MoM growth. Fully automated Python pipeline via the AutoReport platform.
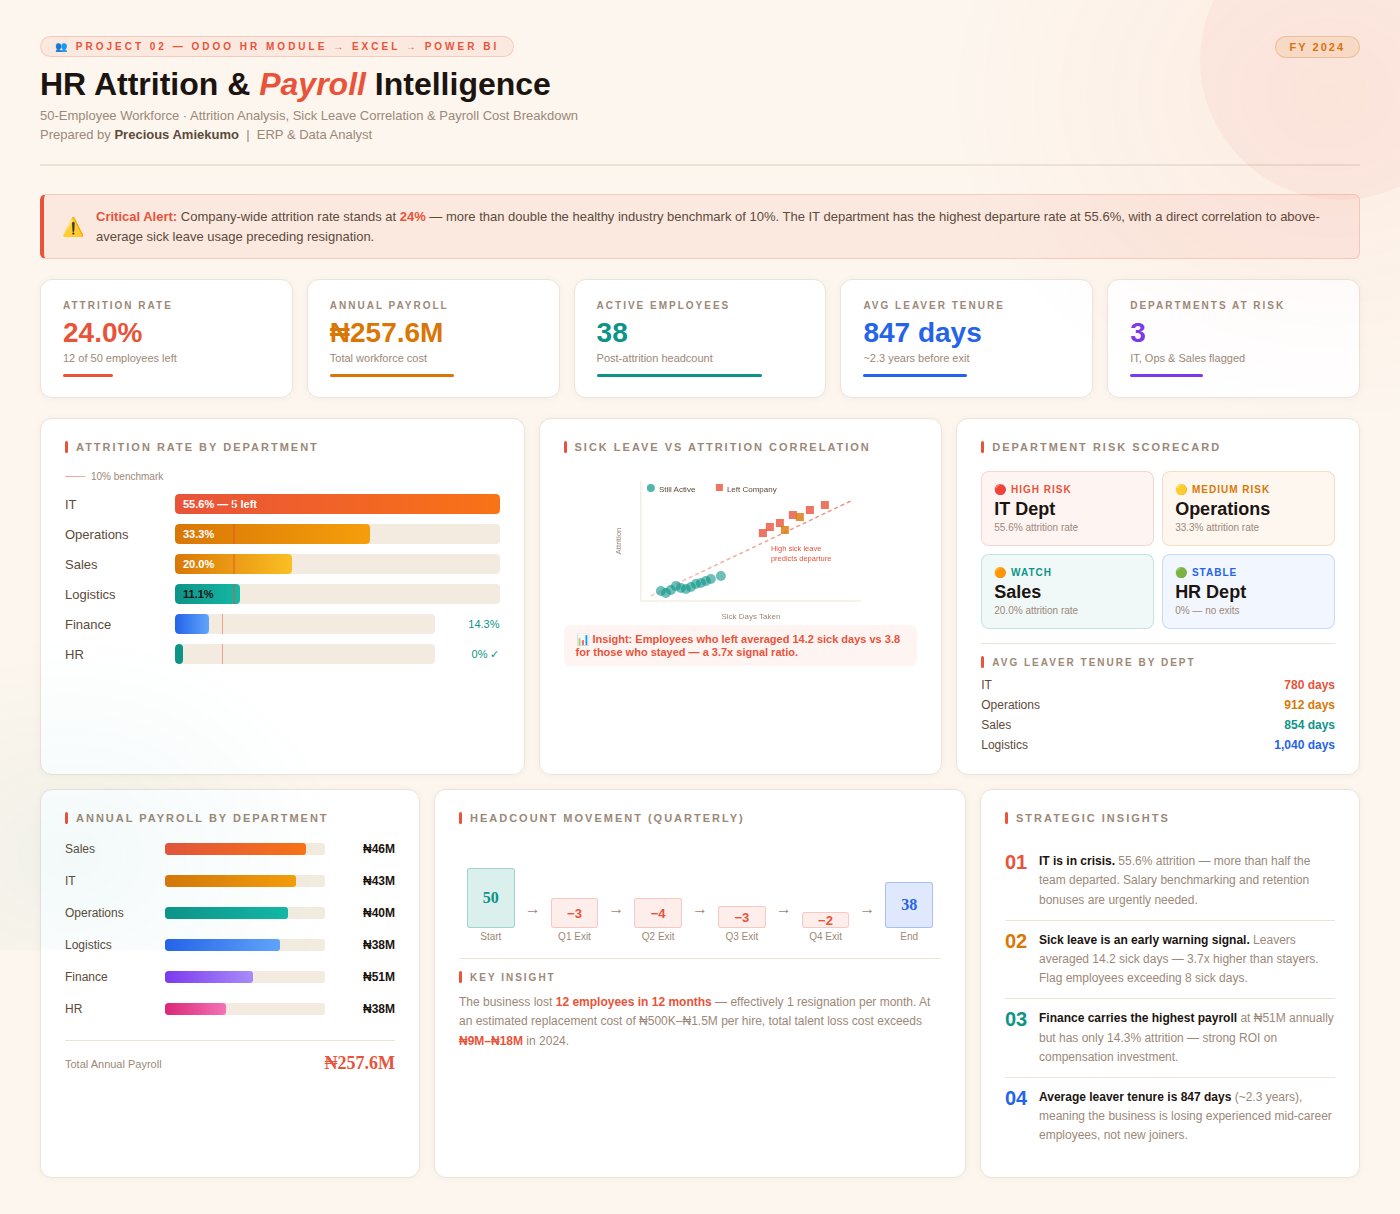
50-employee workforce analysis: 24% attrition rate, ₦257.6M payroll, 3 departments at risk. Sick leave predicts departures 3.7× above baseline.
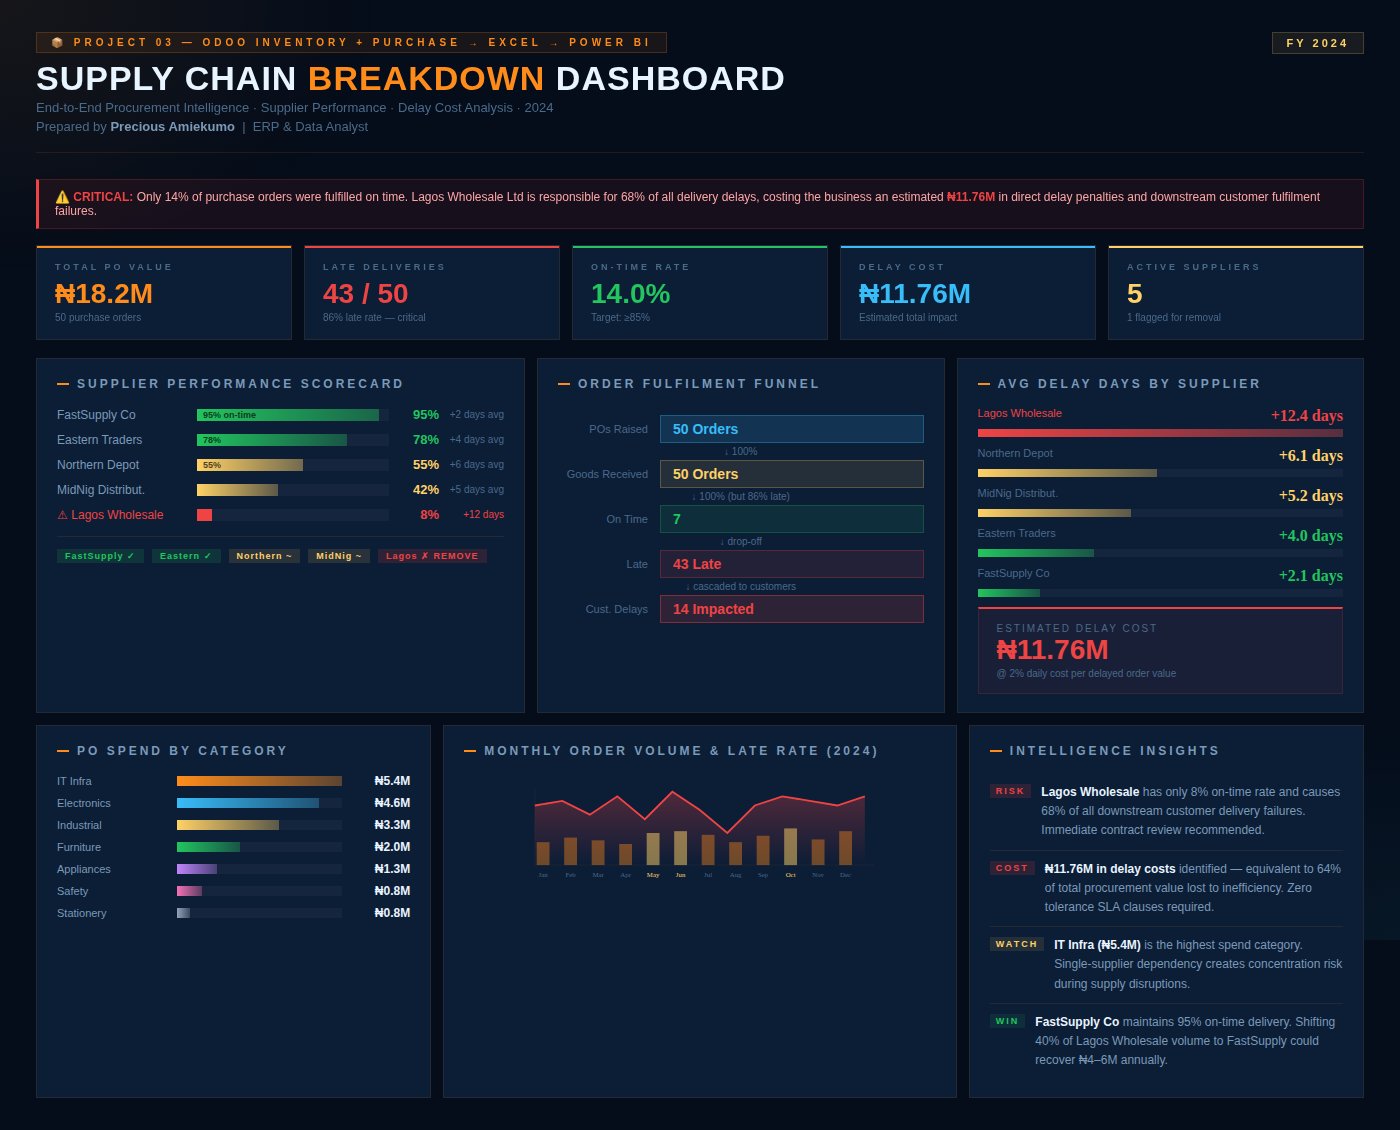
₦18.2M PO value, 86% late delivery rate, ₦11.76M delay cost identified. One supplier responsible for 68% of all downstream failures.
Explore real salary benchmarks across 9 roles, 5 cities, and 3 experience levels — based on the Nigerian Tech Salary Report 2026. Filter below to see your market value.
Multi-tenant nightclub management SaaS — 9 modules: POS, inventory, events, procurement, finance, staff, audit logging, smart tools, Paystack billing.
Business website for ProStackNG Technologies — SaaS products, digital services. Mobile-first, Vercel deployed with PWA.
Multi-tenant CBT SaaS for Nigerian schools — Turborepo monorepo, Next.js 14 + Express/TypeScript. Railway deployed.
Full academic management system — student portals, hostel management, programme registry, admin workflows. React/Vite + Node.js + Supabase.
Automated analytics engine — pulls sales data, generates Power BI dashboards, delivers intelligence reports automatically.
AI-enhanced tender discovery platform — helping Nigerian businesses find procurement opportunities and automate tracking.
Nigeria's first escrow-native marketplace — buyers pay into escrow, vendor delivers, buyer confirms, then vendor gets paid. State + University dual-rail commerce across 37 Nigerian states and 13+ universities. KYC-verified vendors, Paystack/Flutterwave payments, real-time chat.
Self-hosted CI/CD, hosting, and database infrastructure replacing Render + Vercel + Supabase on a single server. GitHub push triggers automatic Docker build, zero-downtime swap, and instant live deployment. Includes on-demand PostgreSQL provisioning and S3-compatible object storage.
SaaS connecting Nigerian university students with expert academic support — consultation flow, secure Paystack payments (60/40 deposit split), real-time Socket.io chat, AI price estimation via Groq, web push notifications, referral programme, and campus ambassador system.
Enterprise ERP and CRM for African SMEs — full Nigerian regulatory compliance (FIRS VAT 7.5%, PAYE, PenCom pension, NHF, ICAN Chart of Accounts). CRM pipeline, invoicing, double-entry accounting, inventory, HR and payroll, and BI dashboards. ERP integration engine auto-posts GL journal entries on every transaction.
Unified API gateway for Nigerian developers — payments (Paystack/Flutterwave), SMS/email, BVN/NIN identity verification, airtime/data/electricity VTU, and report generation, all behind one API key and a Naira wallet. TypeScript and Python SDKs published on npm and PyPI. Built in Rust for high-throughput performance.
Across all live platforms and delivered projects — these are the production metrics that matter.
With 200M+ people, fragmented ERP adoption, and a SaaS gap in vertical markets — Nigeria is one of the world's biggest untapped digital opportunities. I build from Nigeria, with full understanding of its market realities, payment infrastructure, and business culture.
Precious delivered a Power BI dashboard that gave us complete visibility into our 5-branch operations for the first time. The petroleum chain analysis was exactly what management needed to make smarter decisions.
ClubOps transformed how we manage our venue. POS, inventory, and financial reporting all in one place. Precious understood our business deeply before writing a single line of code.
The academic management system streamlined our workflows significantly. Student records, hostel assignments, and programme management are all automated — something we struggled with for years.
Nigerian-market aware, deadline-driven, backed by real deployed experience.
All prices in Nigerian Naira · International clients welcome · Remote-first
No long emails, no back-and-forth. Pick a time that works for you and let's talk about your project, role, or collaboration idea directly.
Or pick a slot directly on the right →
Open to freelance projects, full-time roles, and strategic collaborations — data analytics, SaaS development, or both.