Data Cleaning in SQL
In this project I took raw housing data (CSV file) and cleaned
it in SQL Query to make it more usable for analysis.
.

Data Analyst skilled in SQl, Tableau, Excel, Power BI, and Python @Preciousamiekumo
In this project I took raw housing data (CSV file) and cleaned
it in SQL Query to make it more usable for analysis.
.


In this project I used SQL server to explore global COVID 19 data. I made use of Joins, CTE's, Temp Tables, Windows Functions, Aggregate Functions, Creating Views, Converting Data Types.

This tableau project extensively shows the AirBnB housing data for Seattle. The data was cleaned in microsoft Excel and visualized in Tableau public.

In this project I looked at what variables affect the gross revenue from movies. Using; pandas, numpy, and matplotlib.

In this project I scrape data from Jumia to analyze price data for products. Using; BeautifulSoup and requests.

In this project I imported the raw data into Excel from the source (CSV file), afterward I cleaned the data, checked for missing values, and duplicates. I used Pivot Table to summarize and aggregate data for visualization. Similarly I created a dashboard to visualize the data.
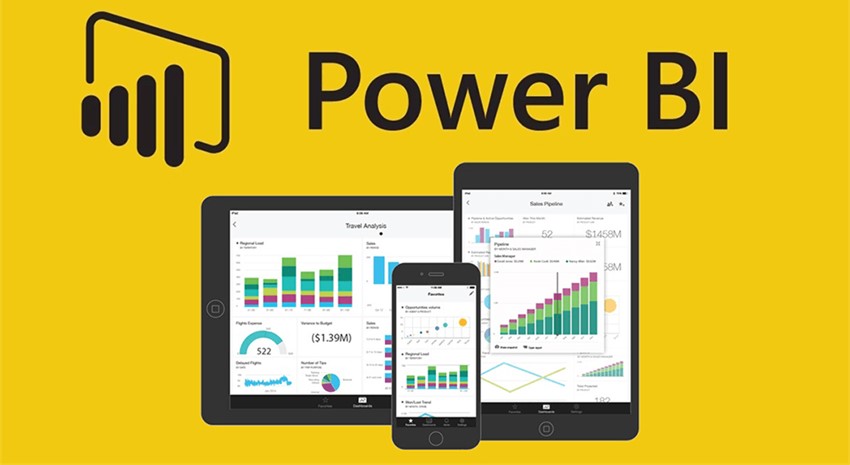
I started this project by transformating the data imported from source (CSV file), in Power Query Editor to clean up the data; missing values, duplicates, and inconsistencies. The transformations were applied to standardize data types, formats, and units, and relationships were established between tables. Then, I visualized the data, creating reports with charts for a comprehensive visualization. I also included titles, and labels, ensuring appealing visualizations to help understand the interactive Power BI report.